WWR
Westwater Resources, Inc.
Price Chart
Latest Quote
$0.42
-0.01 (-3.30%)
Current Price
| Previous Close | $0.44 |
| Open | $0.42 |
| Day High | $0.43 |
| Day Low | $0.42 |
| Volume | 500,609 |
Stock Information
| Shares Outstanding | 127.13M |
| Total Debt | $3.93M |
| Cash Equivalents | $41.46M |
| Net Income | $-29.32M |
| Sector | Basic Materials |
| Industry | Other Industrial Metals & Mining |
| Market Cap | $52.12M |
| EPS (TTM) | $-0.31 |
| Exchange | ASE |
📊 Comprehensive Analysis
Company Data
| Enterprise Value | $14.59M |
| Income | $-29.32M |
| Book/sh | $1.54 |
| Cash/sh | $0.33 |
| Employees | 20 |
Financial Ratios
| Quick Ratio | 4.58 |
| Current Ratio | 4.67 |
| Debt/Eq | 2.20 |
Returns & Margins
| ROA | -6.12% |
| ROE | -18.70% |
Ownership
| Insider Ownership | 5.55% |
| Institutional Ownership | 13.68% |
| Insider & Institutional transactions data not available | |
Valuation Ratios
| Forward P/E | -13.67 |
| PEG | -1.39 |
| P/B | 0.27 |
Analyst Data
| Recommendation | none |
| Target Price | $2.25 |
Technical Indicators
| SMA20 | $0.48 |
| SMA50 | $0.53 |
| SMA200 | $0.89 |
| RSI | 29.41 |
| ATR | 0.0221 |
| Shares Float | 121.25M |
| Short Float | 0.93% |
| Short Ratio | 1.25 |
| Volatility | 1.57 |
| Rel Volume | 0.79 |
Performance History
| Week | -12.77% |
| Month | -25.45% |
| Quarter | -38.81% |
| 6 Months | -66.67% |
| YTD | -50.60% |
| Year | -31.67% |
| 3 Years | -50.00% |
| 5 Years | -90.68% |
| 10 Years | -99.48% |
Stock Score:
⭐ Premium
Based on debt, profitability, growth, and cash flow metrics
⭐ Premium Feature
Sign up for free to view detailed scoring breakdown — premium is free during our trial period!
Recent Price History
| Date | Close | Volume |
|---|---|---|
| 2026-07-17 | $0.41 | 561,200 |
| 2026-07-16 | $0.42 | 512,700 |
| 2026-07-15 | $0.44 | 730,600 |
| 2026-07-14 | $0.43 | 614,000 |
| 2026-07-13 | $0.44 | 1,177,500 |
| 2026-07-10 | $0.47 | 336,900 |
| 2026-07-09 | $0.48 | 588,200 |
| 2026-07-08 | $0.47 | 596,400 |
| 2026-07-07 | $0.48 | 892,300 |
| 2026-07-06 | $0.49 | 998,400 |
| 2026-07-02 | $0.49 | 798,400 |
| 2026-07-01 | $0.49 | 490,900 |
| 2026-06-30 | $0.51 | 746,000 |
| 2026-06-29 | $0.50 | 603,700 |
| 2026-06-26 | $0.48 | 582,600 |
| 2026-06-25 | $0.49 | 681,900 |
| 2026-06-24 | $0.48 | 969,600 |
| 2026-06-23 | $0.50 | 745,000 |
| 2026-06-22 | $0.51 | 804,100 |
| 2026-06-18 | $0.53 | 759,900 |
About Westwater Resources, Inc.
Westwater Resources, Inc., an energy technology company, focuses on developing battery-grade natural graphite materials in the United States. It primarily holds interests in the Coosa Graphite project covering an area of approximately 41,965 acres situated in east-central Alabama, near the western end of Coosa County; and the Kellyton Graphite plant located near Kellyton, Alabama. The company was formerly known as Uranium Resources, Inc. and changed its name to Westwater Resources, Inc. in August 2017. The company was incorporated in 1977 and is headquartered in Centennial, Colorado.
📰 Latest News
Westwater Resources (WWR) Stock Gets Fair Value Boost As Kellyton Progress Shapes Analyst View
Simply Wall St. • 2026-06-28T04:15:08Z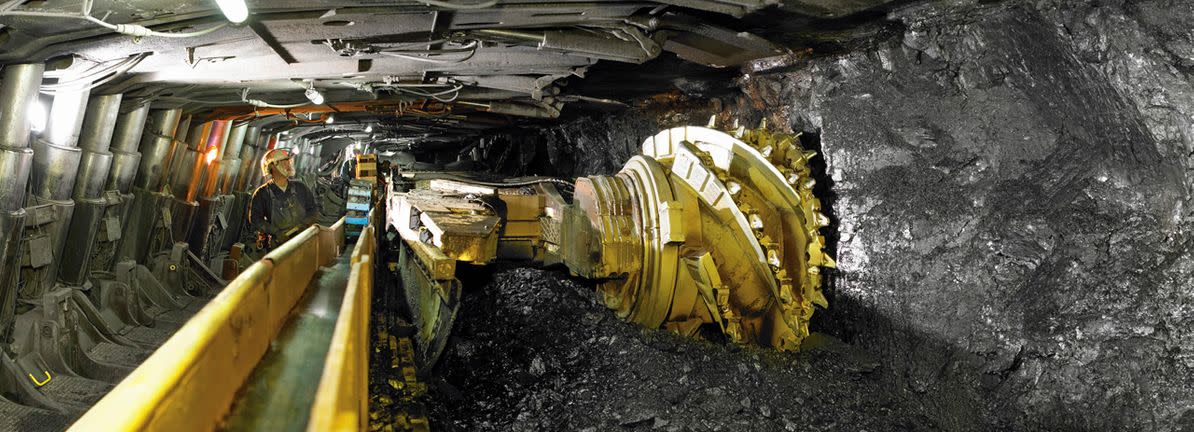
Westwater Resources Inc (WWR) Q1 2026 Earnings Call Highlights: Advancing Graphite Projects ...
GuruFocus.com • 2026-05-13T23:03:26ZWestwater Resources, Inc. Q1 2026 Earnings Call Summary
Moby • 2026-05-13T17:05:51Z
Westwater Resources Reports Q1 2026 Results: Full Earnings Call Transcript
Benzinga • 2026-05-13T16:08:33Z
Westwater Resources Inc (WWR) Q4 2025 Earnings Call Highlights: Strategic Advances Amid ...
GuruFocus.com • 2026-03-20T19:00:53ZH.C. Wainwright Sees Opportunity After Fiat Chrysler Ends Offtake Agreement With Westwater Resources, Inc. (WWR)
Insider Monkey • 2026-03-02T17:44:13Z
Rare Earth Stocks Backslide After Trump Takes Stake In USA Rare Earth
Investor's Business Daily • 2026-01-27T12:51:28Z
Westwater Resources (WWR): Valuation Perspective as Kellyton Graphite Plant Nears Launch and Financing Advances
Simply Wall St. • 2025-10-17T08:10:15Z
Why Westwater Resources (WWR) Is Up 138.4% After Major Progress at Kellyton Graphite Plant and US Policy Wins
Simply Wall St. • 2025-10-15T12:07:15Z
Westwater Resources Inc (WWR) Q2 2025 Earnings Call Highlights: Strategic Advancements Amid ...
GuruFocus.com • 2025-08-17T23:00:33Z
Period:
Loading...
Income Statement (Annual)
| Metric | 2025-12-31 | 2024-12-31 | 2023-12-31 | 2022-12-31 |
|---|---|---|---|---|
| Revenue | ||||
| Reconciled Cost Of Revenue | $784,000 | $284,000 | $255,000 | $180,000 |
| Cost Of Revenue | $784,000 | $284,000 | $255,000 | $180,000 |
| Total Revenue | $0 | $0 | $0 | $0 |
| Operating Revenue | $0 | $0 | $0 | $0 |
| Expenses | ||||
| Total Expenses | $14,530,000 | $11,468,000 | $13,271,000 | $11,983,000 |
| Other Income Expense | $-11,846,000 | $-1,465,000 | $4,172,000 | $-192,000 |
| Other Non Operating Income Expenses | $-461,000 | $7,000 | $10,000 | $2,000 |
| Net Non Operating Interest Income Expense | $-950,000 | $276,000 | $1,348,000 | $1,054,000 |
| Total Other Finance Cost | $1,420,000 | - | - | - |
| Operating Expense | $13,746,000 | $11,184,000 | $13,016,000 | $11,803,000 |
| Other Operating Expenses | $227,000 | $20,000 | $301,000 | $756,000 |
| General And Administrative Expense | $12,380,000 | $9,987,000 | $9,780,000 | $9,902,000 |
| Selling And Marketing Expense | - | - | - | - |
| Income & Earnings | ||||
| Net Income From Continuing Operation Net Minority Interest | $-27,326,000 | $-12,657,000 | $-7,751,000 | $-11,121,000 |
| Net Interest Income | $-950,000 | $276,000 | $1,348,000 | $1,054,000 |
| Interest Income | $470,000 | $276,000 | $1,348,000 | $1,054,000 |
| Normalized Income | $-15,941,000 | $-11,185,000 | $-11,913,000 | $-10,927,000 |
| Net Income From Continuing And Discontinued Operation | $-27,326,000 | $-12,657,000 | $-7,751,000 | $-11,121,000 |
| Net Income Common Stockholders | $-27,326,000 | $-12,657,000 | $-7,751,000 | $-11,121,000 |
| Net Income | $-27,326,000 | $-12,657,000 | $-7,751,000 | $-11,121,000 |
| Net Income Including Noncontrolling Interests | $-27,326,000 | $-12,657,000 | $-7,751,000 | $-11,121,000 |
| Net Income Continuous Operations | $-27,326,000 | $-12,657,000 | $-7,751,000 | $-11,121,000 |
| Pretax Income | $-27,326,000 | $-12,657,000 | $-7,751,000 | $-11,121,000 |
| Special Income Charges | $0 | $-1,468,000 | $4,208,000 | $-142,000 |
| Interest Income Non Operating | $470,000 | $276,000 | $1,348,000 | $1,054,000 |
| Operating Income | $-14,530,000 | $-11,468,000 | $-13,271,000 | $-11,983,000 |
| Gross Profit | $-784,000 | $-284,000 | $-255,000 | $-180,000 |
| Total Operating Income As Reported | - | - | - | - |
| Net Income Discontinuous Operations | - | - | - | - |
| Per Share | ||||
| Diluted EPS | $-0.32 | $-0.22 | $-0.15 | $-0.25 |
| Basic EPS | $-0.32 | $-0.22 | $-0.15 | $-0.25 |
| Other | ||||
| Tax Effect Of Unusual Items | $0 | $0 | $0 | $0 |
| Tax Rate For Calcs | $0 | $0 | $0 | $0 |
| Normalized EBITDA (Bullshit earnings) | $-2,400,000 | $-9,747,000 | $-17,212,000 | $-11,643,000 |
| Total Unusual Items | $-11,385,000 | $-1,472,000 | $4,162,000 | $-194,000 |
| Total Unusual Items Excluding Goodwill | $-11,385,000 | $-1,472,000 | $4,162,000 | $-194,000 |
| Reconciled Depreciation | $745,000 | $249,000 | $221,000 | $146,000 |
| EBITDA (Bullshit earnings) | $-13,785,000 | $-11,219,000 | $-13,050,000 | $-11,837,000 |
| EBIT | $-14,530,000 | $-11,468,000 | $-13,271,000 | $-11,983,000 |
| Diluted Average Shares | $86,023,787 | $58,538,139 | $52,037,463 | $44,909,500 |
| Basic Average Shares | $86,023,787 | $58,538,139 | $52,037,463 | $44,909,500 |
| Diluted NI Availto Com Stockholders | $-27,326,000 | $-12,657,000 | $-7,751,000 | $-11,121,000 |
| Write Off | $0 | $964,000 | $-1,150,000 | $0 |
| Restructuring And Mergern Acquisition | $0 | $504,000 | $42,000 | - |
| Gain On Sale Of Security | $-11,385,000 | $-4,000 | $-46,000 | $-52,000 |
| Research And Development | $1,139,000 | $1,177,000 | $2,935,000 | $1,145,000 |
| Selling General And Administration | $12,380,000 | $9,987,000 | $9,780,000 | $9,902,000 |
| Other Gand A | $12,380,000 | $9,987,000 | $9,780,000 | $9,902,000 |
| Other Special Charges | - | - | $-3,100,000 | $142,000 |
| Gain On Sale Of Ppe | - | - | - | - |
| Insurance And Claims | - | - | - | - |
| Salaries And Wages | - | - | - | - |
Fetched: 2026-07-09
Balance Sheet (Annual)
| Metric | 2025-12-31 | 2024-12-31 | 2023-12-31 | 2022-12-31 |
|---|---|---|---|---|
| Assets | ||||
| Net Tangible Assets | $181,529,000 | $133,122,000 | $140,443,000 | $141,968,000 |
| Total Assets | $194,533,000 | $146,357,000 | $149,831,000 | $168,408,000 |
| Total Non Current Assets | $145,663,000 | $141,494,000 | $138,217,000 | $92,320,000 |
| Other Non Current Assets | $2,470,000 | $3,626,000 | $5,461,000 | $2,155,000 |
| Current Assets | $48,870,000 | $4,863,000 | $11,614,000 | $76,088,000 |
| Other Current Assets | $35,000 | $41,000 | $99,000 | $892,000 |
| Prepaid Assets | $87,000 | $90,000 | $663,000 | - |
| Inventory | $172,000 | $460,000 | $0 | - |
| Cash Cash Equivalents And Short Term Investments | $48,576,000 | $4,272,000 | $10,852,000 | $75,196,000 |
| Cash And Cash Equivalents | $48,576,000 | $4,272,000 | $10,852,000 | $75,196,000 |
| Debt | ||||
| Total Debt | $6,282,000 | $140,000 | $357,000 | $91,000 |
| Current Debt And Capital Lease Obligation | $6,282,000 | $140,000 | $122,000 | $91,000 |
| Current Debt | $5,973,000 | - | - | - |
| Other Current Borrowings | $5,973,000 | - | - | - |
| Long Term Debt And Capital Lease Obligation | - | $95,000 | $235,000 | - |
| Liabilities | ||||
| Total Liabilities Net Minority Interest | $13,004,000 | $13,235,000 | $9,388,000 | $26,440,000 |
| Total Non Current Liabilities Net Minority Interest | $1,382,000 | $1,473,000 | $1,613,000 | $1,378,000 |
| Other Non Current Liabilities | $1,382,000 | $1,473,000 | $1,378,000 | $1,378,000 |
| Current Liabilities | $11,622,000 | $11,762,000 | $7,775,000 | $25,062,000 |
| Payables And Accrued Expenses | $4,354,000 | $10,293,000 | $6,722,000 | $24,971,000 |
| Payables | $3,989,000 | $9,517,000 | $5,957,000 | $23,008,000 |
| Accounts Payable | $3,989,000 | $9,517,000 | $5,957,000 | $23,008,000 |
| Other Payable | - | - | - | $1,151,000 |
| Equity | ||||
| Common Stock Equity | $181,529,000 | $133,122,000 | $140,443,000 | $141,968,000 |
| Total Equity Gross Minority Interest | $181,529,000 | $133,122,000 | $140,443,000 | $141,968,000 |
| Stockholders Equity | $181,529,000 | $133,122,000 | $140,443,000 | $141,968,000 |
| Retained Earnings | $-401,012,000 | $-373,686,000 | $-361,029,000 | $-353,278,000 |
| Other | ||||
| Treasury Shares Number | $161 | $161 | $161 | $161 |
| Ordinary Shares Number | $117,989,464 | $64,829,920 | $55,387,633 | $48,405,382 |
| Share Issued | $117,989,625 | $64,830,081 | $55,387,794 | $48,405,543 |
| Tangible Book Value | $181,529,000 | $133,122,000 | $140,443,000 | $141,968,000 |
| Invested Capital | $187,502,000 | $133,122,000 | $140,443,000 | $141,968,000 |
| Working Capital | $37,248,000 | $-6,899,000 | $3,839,000 | $51,026,000 |
| Capital Lease Obligations | $309,000 | $140,000 | $357,000 | $91,000 |
| Total Capitalization | $181,529,000 | $133,122,000 | $140,443,000 | $141,968,000 |
| Treasury Stock | $258,000 | $258,000 | $258,000 | $258,000 |
| Additional Paid In Capital | $582,681,000 | $507,001,000 | $501,675,000 | $495,456,000 |
| Capital Stock | $118,000 | $65,000 | $55,000 | $48,000 |
| Common Stock | $118,000 | $65,000 | $55,000 | $48,000 |
| Current Capital Lease Obligation | $309,000 | $140,000 | $122,000 | $91,000 |
| Pensionand Other Post Retirement Benefit Plans Current | $986,000 | $1,329,000 | $931,000 | - |
| Current Accrued Expenses | $365,000 | $776,000 | $765,000 | $1,963,000 |
| Net PPE | $143,193,000 | $137,868,000 | $132,756,000 | $90,165,000 |
| Accumulated Depreciation | $-1,453,000 | $-713,000 | $-470,000 | $-257,000 |
| Gross PPE | $144,646,000 | $138,581,000 | $133,226,000 | $90,422,000 |
| Other Properties | $144,646,000 | $138,581,000 | $133,226,000 | $90,422,000 |
| Raw Materials | $172,000 | $460,000 | $0 | - |
| Long Term Capital Lease Obligation | - | $95,000 | $235,000 | $0 |
| Other Short Term Investments | - | - | - | - |
Fetched: 2026-07-09
Cash Flow Statement (Annual)
| Metric | 2025-12-31 | 2024-12-31 | 2023-12-31 | 2022-12-31 |
|---|---|---|---|---|
| Free Cash Flow | ||||
| Free Cash Flow | $-21,585,000 | $-11,960,000 | $-69,725,000 | $-65,967,000 |
| Operating Activities | ||||
| Operating Cash Flow | $-9,897,000 | $-5,814,000 | $-11,430,000 | $-13,176,000 |
| Cash Flow From Continuing Operating Activities | $-9,897,000 | $-5,814,000 | $-11,430,000 | $-13,176,000 |
| Operating Gains Losses | - | - | - | $-1,000 |
| Investing Activities | ||||
| Capital Expenditure | $-11,688,000 | $-6,146,000 | $-58,295,000 | $-52,791,000 |
| Investing Cash Flow | $-11,431,000 | $-4,638,000 | $-58,295,000 | $-52,790,000 |
| Cash Flow From Continuing Investing Activities | $-11,431,000 | $-4,638,000 | $-58,295,000 | $-52,790,000 |
| Net Other Investing Changes | $257,000 | $1,508,000 | - | - |
| Capital Expenditure Reported | $-11,688,000 | $-6,146,000 | $-58,295,000 | $-52,791,000 |
| Financing Activities | ||||
| Issuance Of Capital Stock | $56,667,000 | $4,110,000 | $5,497,000 | $25,901,000 |
| Financing Cash Flow | $65,632,000 | $3,872,000 | $5,381,000 | $25,869,000 |
| Cash Flow From Continuing Financing Activities | $65,632,000 | $3,872,000 | $5,381,000 | $25,869,000 |
| Net Other Financing Charges | $-790,000 | $-232,000 | $-108,000 | $-32,000 |
| Net Common Stock Issuance | $56,667,000 | $4,110,000 | $5,497,000 | $25,901,000 |
| Common Stock Issuance | $56,667,000 | $4,110,000 | $5,497,000 | $25,901,000 |
| Other | ||||
| Repayment Of Debt | $-362,000 | $-6,000 | $-8,000 | $0 |
| Issuance Of Debt | $10,000,000 | $0 | - | - |
| End Cash Position | $48,576,000 | $4,272,000 | $10,852,000 | $75,196,000 |
| Beginning Cash Position | $4,272,000 | $10,852,000 | $75,196,000 | $115,293,000 |
| Changes In Cash | $44,304,000 | $-6,580,000 | $-64,344,000 | $-40,097,000 |
| Proceeds From Stock Option Exercised | $117,000 | $0 | - | - |
| Net Issuance Payments Of Debt | $9,638,000 | $-6,000 | $-8,000 | $0 |
| Net Short Term Debt Issuance | $5,000,000 | $0 | - | - |
| Short Term Debt Issuance | $5,000,000 | $0 | - | - |
| Net Long Term Debt Issuance | $4,638,000 | $-6,000 | $-8,000 | $0 |
| Long Term Debt Payments | $-362,000 | $-6,000 | $-8,000 | $0 |
| Long Term Debt Issuance | $5,000,000 | $0 | - | - |
| Change In Working Capital | $-159,000 | $4,184,000 | $-3,715,000 | $-3,375,000 |
| Change In Other Current Assets | $-407,000 | $2,744,000 | $-3,306,000 | $-2,058,000 |
| Change In Payables And Accrued Expense | $-49,000 | $1,269,000 | $-539,000 | $-648,000 |
| Change In Prepaid Assets | $297,000 | $171,000 | $130,000 | $-669,000 |
| Other Non Cash Items | $12,927,000 | $120,000 | $128,000 | $153,000 |
| Stock Based Compensation | $3,916,000 | $1,326,000 | $837,000 | $1,022,000 |
| Asset Impairment Charge | $0 | $964,000 | $-1,150,000 | $0 |
| Depreciation Amortization Depletion | $745,000 | $249,000 | $221,000 | $146,000 |
| Depreciation And Amortization | $745,000 | $249,000 | $221,000 | $146,000 |
| Net Income From Continuing Operations | $-27,326,000 | $-12,657,000 | $-7,751,000 | $-11,121,000 |
| Net PPE Purchase And Sale | - | - | $0 | $1,000 |
| Sale Of PPE | - | - | $0 | $1,000 |
| Gain Loss On Sale Of PPE | - | - | $0 | $-1,000 |
| Net Investment Purchase And Sale | - | - | - | $0 |
| Sale Of Investment | - | - | - | $0 |
| Change In Inventory | - | - | - | $-785,000 |
| Purchase Of PPE | - | - | - | - |
| Gain Loss On Investment Securities | - | - | - | - |
Fetched: 2026-07-09