SOXQ
Invesco PHLX Semiconductor ETF
Price Chart
Latest Quote
$89.27
+0.37 (+0.42%)
Current Price
| Previous Close | $88.90 |
| Open | $88.57 |
| Day High | $89.66 |
| Day Low | $87.83 |
| Volume | 1,511,908 |
Fund Information
| Quarterly Dividend / Yield | N/A / 0.32% |
| Net Assets | $2.54B |
| Expense Ratio | 0.19% |
| Category | Technology |
| Fund Family | Invesco |
| Net Asset Value | $90.80 |
| Premium/Discount | -1.69% |
| Quarterly Dividend Yield | 0.32% |
| P/E Ratio | 40.03 |
| Exchange | NGM |
📊 ETF Analysis
Company Data
Financial Ratios
Returns & Margins
Ownership
| Insider & Institutional transactions data not available |
Valuation Ratios
Analyst Data
Technical Indicators
| SMA20 | $nan |
| SMA50 | $nan |
| SMA200 | $nan |
| RSI | 28.80 |
| ATR | nan |
| Rel Volume | 0.96 |
Performance History
| Week | nan% |
| Month | nan% |
| Quarter | nan% |
| 6 Months | nan% |
| YTD | nan% |
| Year | nan% |
| 3 Years | nan% |
| 5 Years | nan% |
| 10 Years | nan% |
ETF Scoring Not Available
Exchange-traded funds (ETFs) are not scored using our fundamental analysis metrics, as they represent baskets of securities rather than individual companies.
Recent Price History
| Date | Close | Volume |
|---|---|---|
| 2026-09-02 | $nan | 1,511,908 |
| 2026-09-01 | $88.90 | 3,200,900 |
| 2026-08-31 | $90.76 | 1,013,200 |
| 2026-08-27 | $93.56 | 1,485,200 |
| 2026-08-26 | $91.40 | 892,600 |
| 2026-08-25 | $91.19 | 2,179,500 |
| 2026-08-24 | $89.93 | 1,443,500 |
| 2026-08-21 | $92.42 | 1,256,500 |
| 2026-08-20 | $92.90 | 677,100 |
| 2026-08-19 | $92.39 | 2,102,300 |
| 2026-08-18 | $94.37 | 2,141,000 |
| 2026-08-17 | $99.37 | 806,400 |
| 2026-08-14 | $97.74 | 2,180,400 |
| 2026-08-13 | $98.10 | 1,339,200 |
| 2026-08-12 | $97.56 | 2,959,800 |
| 2026-08-11 | $95.19 | 1,703,300 |
| 2026-08-10 | $94.44 | 1,456,600 |
| 2026-08-07 | $97.20 | 835,800 |
| 2026-08-06 | $94.80 | 984,600 |
| 2026-08-05 | $94.53 | 1,538,700 |
| 2026-08-04 | $95.86 | 1,914,500 |
| 2026-08-03 | $89.98 | 2,526,900 |
About Invesco PHLX Semiconductor ETF
The fund generally will invest at least 90% of its total assets in the securities that comprise the underlying index. Strictly in accordance with its guidelines and mandated procedures, Nasdaq compiles the underlying index, which is a modified market-capitalization weighted index designed to measure the performance of the 30 largest companies listed in the United States that are engaged in the semiconductor business, as determined by the index Provider. The fund is non-diversified.
📰 Latest News
A Guide to Semiconductor ETFs
Zacks • 2026-08-28T16:00:00Z
Worried About Broadcom's Debt? Bet on These Semiconductor ETFs Instead
Zacks • 2026-08-24T18:46:00ZForget SMH. The Chip Fund That Owns Less Nvidia Is Beating It by 20 Points
24/7 Wall St. • 2026-08-08T22:41:06Z
ETFs to Buy as AMD Shares Sink 7% Despite Q2 Earnings Beat
Zacks • 2026-08-07T14:50:00Z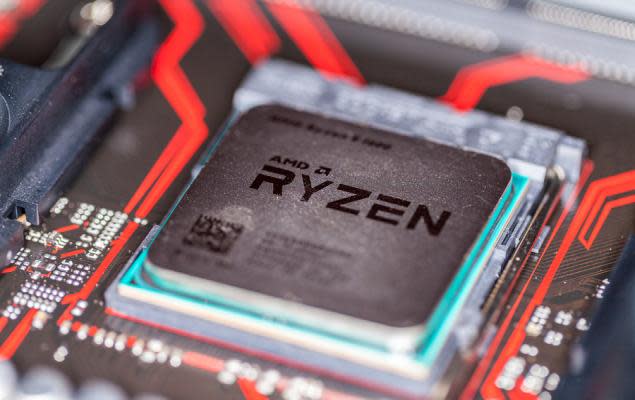
SOXQ ETF Is A Sharper Bet Than Its Name Suggests
Trefis • 2026-07-29T13:30:47Z
Semiconductor ETFs Show They're More Than A Flash In The Pan
Investor's Business Daily • 2026-07-23T11:30:40Z
Which Hot Funds Have Staying Power?
Trefis • 2026-07-14T12:44:13Z
What You Really Own Inside SOXQ ETF
Trefis • 2026-07-06T16:59:49Z
The AI Memory Shortage Just Entered Year Two and These 3 ETFs Own Every Layer From DRAM to HBM
24/7 Wall St. • 2026-07-01T18:24:18Z
Macro Strategist: “We Are Pretty Much In New Territory” As Japanese Yen Hits 40-Year Low
24/7 Wall St. • 2026-07-01T18:14:03Z
Period:
Loading...
No financial data available yet. Financial data will be fetched automatically.