ICLN
iShares Global Clean Energy ETF
Price Chart
Latest Quote
$18.37
+0.02 (+0.11%)
Current Price
| Previous Close | $18.35 |
| Open | $18.07 |
| Day High | $18.61 |
| Day Low | $17.95 |
| Volume | 4,278,310 |
Fund Information
| Quarterly Dividend / Yield | N/A / 0.90% |
| Net Assets | $2.91B |
| Expense Ratio | 0.39% |
| Category | Miscellaneous Sector |
| Fund Family | iShares |
| Net Asset Value | $18.40 |
| Premium/Discount | -0.17% |
| Quarterly Dividend Yield | 0.90% |
| P/E Ratio | 19.86 |
| Exchange | NGM |
📊 ETF Analysis
Company Data
Financial Ratios
Returns & Margins
Ownership
| Insider & Institutional transactions data not available |
Valuation Ratios
Analyst Data
Technical Indicators
| SMA20 | $19.72 |
| SMA50 | $20.92 |
| SMA200 | $18.47 |
| RSI | 39.75 |
| ATR | 0.6893 |
| Rel Volume | 0.90 |
Performance History
| Week | -4.57% |
| Month | -11.77% |
| Quarter | -4.81% |
| 6 Months | +6.10% |
| YTD | +7.72% |
| Year | +37.91% |
| 3 Years | +3.16% |
| 5 Years | -15.47% |
| 10 Years | +139.91% |
ETF Scoring Not Available
Exchange-traded funds (ETFs) are not scored using our fundamental analysis metrics, as they represent baskets of securities rather than individual companies.
Recent Price History
| Date | Close | Volume |
|---|---|---|
| 2026-07-17 | $18.37 | 4,327,600 |
| 2026-07-16 | $18.35 | 3,924,400 |
| 2026-07-15 | $19.08 | 3,390,900 |
| 2026-07-14 | $19.07 | 3,806,000 |
| 2026-07-13 | $18.63 | 3,511,700 |
| 2026-07-10 | $19.25 | 5,078,900 |
| 2026-07-09 | $19.33 | 2,368,000 |
| 2026-07-08 | $19.05 | 5,024,100 |
| 2026-07-07 | $19.33 | 4,170,500 |
| 2026-07-06 | $20.12 | 3,271,200 |
| 2026-07-02 | $19.67 | 4,389,100 |
| 2026-07-01 | $20.18 | 6,278,800 |
| 2026-06-30 | $20.49 | 6,833,500 |
| 2026-06-29 | $19.88 | 7,937,900 |
| 2026-06-26 | $19.50 | 9,062,100 |
| 2026-06-25 | $20.29 | 6,704,200 |
| 2026-06-24 | $20.48 | 2,808,900 |
| 2026-06-23 | $20.67 | 3,539,700 |
| 2026-06-22 | $21.63 | 3,142,800 |
| 2026-06-18 | $21.10 | 6,530,300 |
About iShares Global Clean Energy ETF
The index is designed to track the performance of approximately 100 clean energy-related companies. The fund generally invests at least 80% of its assets in the component securities of the index and in investments that have economic characteristics that are substantially identical to the component securities of the index and may invest up to 20% of its assets in certain futures, options and swap contracts, cash and cash equivalents, as well as in securities not included in the index. It is non-diversified.
📰 Latest News
AMLP vs ICLN: Are High Yield MLPs or Clean Energy Growth Stocks the Better Buy in 2026?
Motley Fool • 2026-07-13T17:52:25Z
What's Inside ICLN Decides If This Dip Recovers
Trefis • 2026-07-13T12:42:43Z
Bloom Energy (BE) Is Down 9.7% After Scandium Supply Dispute And $25B AI Power Deal Expansion
Simply Wall St. • 2026-07-10T22:13:36Z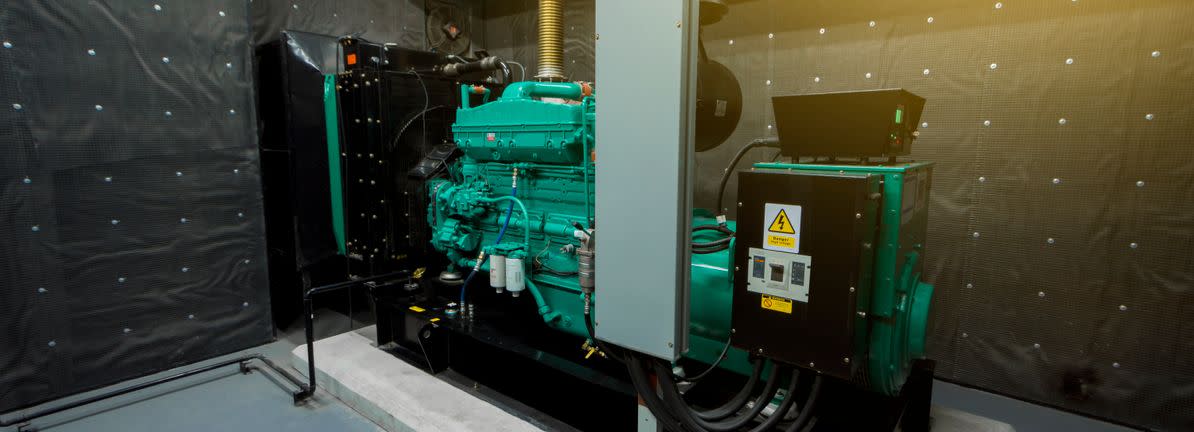
XLE vs ICLN ETF Showdown Traditional Energy Meets Clean Energy. Which ETF Is the Better Buy?
Motley Fool • 2026-07-10T20:57:01Z
What ICLN's Basket Says About Buying This Dip
Trefis • 2026-07-10T11:41:01Z
What ICLN's Concentrated Holdings Say About This Dip
Trefis • 2026-07-09T16:54:10Z
FuelCell Energy Sinks 14%, Bloom Energy Slides 8% After $225M FCEL Share Sale Prices at $21; Plug Power Treads Water
24/7 Wall St. • 2026-07-08T15:20:26Z
How Much Bloom Energy Stock Are You Really Betting On?
Trefis • 2026-07-08T13:01:52Z
TAN’s 82% Rally Masks a Quiet $3,350 Tax on $50,000 Over a Decade
24/7 Wall St. • 2026-06-23T22:43:24Z
Amid the Power Boom, Should You Buy a Clean Energy ETF or a Nuclear and Uranium ETF?
Motley Fool • 2026-06-21T10:56:01Z
Period:
Loading...
No financial data available yet. Financial data will be fetched automatically.